Hi,
We had the necessity to add the consumer.lag check to datadog. Since we did not have access to the kafka.consumer domain which from what i believe it’s on the client side i decided to connect to the kafka node using JMX (so JConsole was the tool). At MBeans tab you will gladly see that there isn’t what you need by default for kafka.consumer.max_lag. The actual info you can grab is located under kafka.server and even more accurate under FetcherLagMetrics as shown.
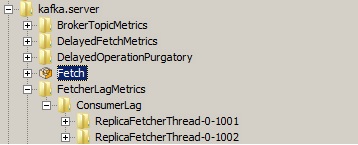
If you go all the way down on the hierarchy, you will get partition 0 details for one of the topics. I will use this example for base construct of regex tag:
kafka.server:type=FetcherLagMetrics,name=ConsumerLag,clientId=ReplicaFetcherThread-0-1001,topic=__consumer_offsets,partition=0
Using the same template you can directly construct the block that you need to add to kafka.yaml and it should look like this:
 - include:
        domain: 'kafka.server'
        bean_regex: 'kafka\.server:type=FetcherLagMetrics,name=ConsumerLag,clientId=.*'
        attribute:
          Value:
            metric_type: rate
            alias: kafka.consumer.lag
After a agent restart you will gladly see that the number of metrics that are collected increases and you have a new check in the datadog web interface.
After that, you can manually add in the dashboard a new graph that uses this check and you can also configure it on specific criteria, like host, topic, partition.
Hope this is helpful,
Cheers