Hi,
I just started a recap of calculus and wanted to know how and if it’s hard to plot functions in a programming language.
Searching this topic I found this article, which gives an elegant approach:
https://scriptverse.academy/tutorials/python-matplotlib-plot-function.html
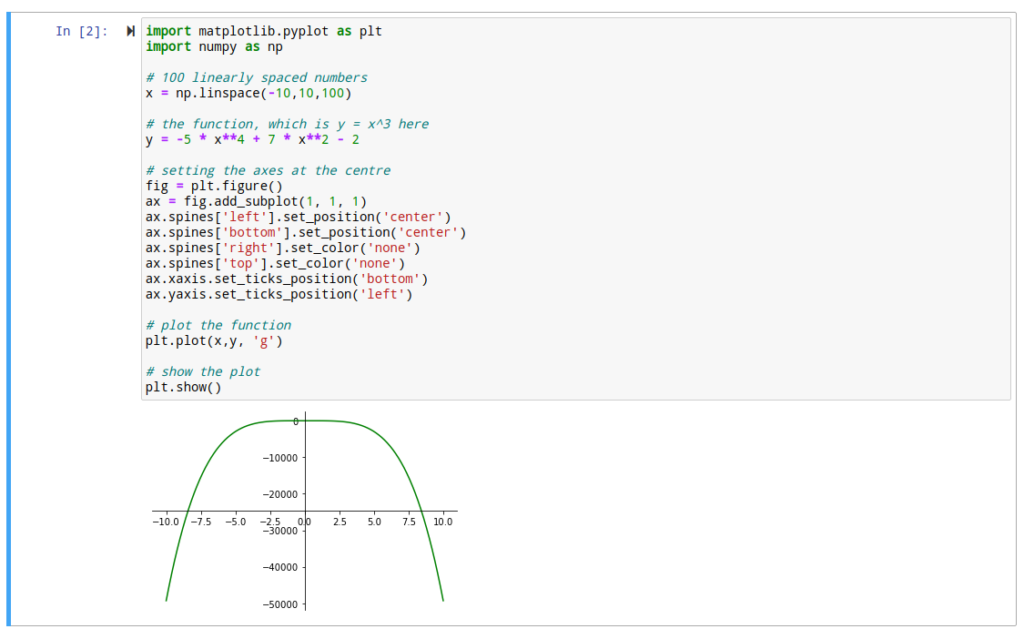
After trying the code here is the result

Surely there are even more complex cases but at least there is a start for adapting the code.
Cheers