Hi,
As you probably know, Kafka is already publishing a lot of performance data on JMX to be collected.
In order to do this, you will need to install jconsole (for Windows it’s already embedded in the jdk installation, for Linux you can use this article to check it out https://www.garron.me/en/linux/find-which-package-library-belongs.html. After you have done that, you will have just to export the JMX_PORT variable to you env (for example export JMX_PORT=9999) before you start the Kafka node. When you will open JConsole you will probably see something like
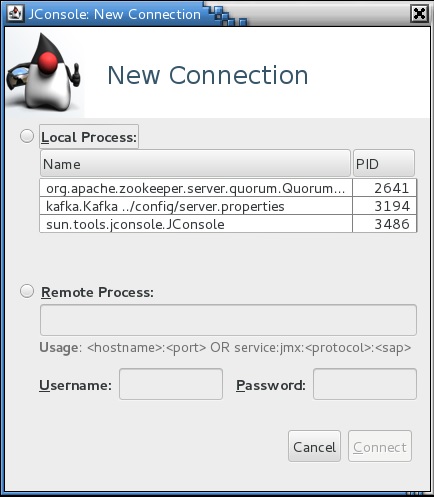
After you select the Kafka node, it will tell you that the connection is not secure, but it doesn’t matter for my point of view and after that you can have a overview of the process. The statistics are available MBens tab and extra info regarding the meaning you can find in the official doku and also in the DataDog article.
This is a single simple node configuration, if it is required i will post some complex configurations, but this is required in special cases, standard monitoring using DataDog/Prometheus or other solution needs to be implemented in case of a bigger infrastructure.
Cheers