• How to deploy Prometheus infrastructure for Kafka monitoring using puppet

    Hi,

    In the last couple of days i worked on deployment of Prometheus server and agent for Kafka monitoring. In that purpose i will share with you the main points that you need to do in order to achieve this.

    First thing to do is to use the prometheus and grafana modules that you will find at the following links:

    https://forge.puppet.com/puppet/prometheus
    https://forge.puppet.com/puppet/grafana

    After these are imported in puppet you need to create the following puppet files:

    grafana.pp

    class profiles::grafana {
        class { '::grafana':
          cfg => {
            app_mode => 'production',
            server   => {
              http_port     => 8080,
            },
            database => {
              type     => 'sqlite3',
              host     => '127.0.0.1:3306',
              name     => 'grafana',
              user     => 'root',
              password => 'grafana',
            },
            users    => {
              allow_sign_up => false,
            },
          },
        }
    }

    puppetserver.pp

    class profiles::prometheusserver {
        $kafka_nodes=hiera(profiles::prometheusserver::nodes)
       
        if $kafka_nodes {
    	class {'::prometheus':
    	   global_config  => { 'scrape_interval'=> '15s', 'evaluation_interval'=> '15s', 'external_labels'=> { 'monitor'=>'master'}},
           rule_files     => [ "/etc/prometheus/alert.rules" ],
           scrape_configs => [ {'job_name'=>'prometheus','scrape_interval'=> '30s','scrape_timeout'=>'30s','static_configs'=> [{'targets'=>['localhost:9090'], 'labels'=> { 'alias'=>'Prometheus'}}]},{'job_name'=> kafka, 'scrape_interval'=> '10s', 'scrape_timeout'=> '10s', 'static_configs'=> [{'targets'=> $kafka_nodes }]}],
        }
       
        } else {
        class {'::prometheus':
    	   global_config  => { 'scrape_interval'=> '15s', 'evaluation_interval'=> '15s', 'external_labels'=> { 'monitor'=>'master'}},
           rule_files     => [ "/etc/prometheus/alert.rules" ],
           scrape_configs => [ {'job_name'=>'prometheus','scrape_interval'=> '30s','scrape_timeout'=>'30s','static_configs'=> [{'targets'=>['localhost:9090'], 'labels'=> { 'alias'=>'Prometheus'}}]}],
        }
        }
    }

    prometheusnode.pp

    class profiles_opqs::prometheusnode(
    	$jmxexporter_dir = hiera('jmxexporter::dir','/opt/jmxexporter'),
    	$jmxexporter_version = hiera('jmxexporter::version','0.9')
    ){
    	include ::prometheus::node_exporter
    	#validate_string($jmxexporter_dir)
    
    	file {"${jmxexporter_dir}":
    		ensure => 'directory',
    	}
    	file {"${jmxexporter_dir}/prometheus_config.yaml":
    		source => 'puppet:///modules/profiles/prometheus_config',
    	}
    	wget::fetch {"https://repo1.maven.org/maven2/io/prometheus/jmx/jmx_prometheus_javaagent/${jmxexporter_version}/jmx_prometheus_javaagent-${jmxexporter_version}.jar":
    	destination => "${jmxexporter_dir}/",
    	cache_dir => '/tmp/',
    	timeout => 0,
    	verbose => false,
    	unless => "test -e ${jmxexporter_dir}/jmx_prometheus_javaagent-${jmxexporter_version}.jar",
    	}	
    }

    It is true that i used the wget module to take the JMX exporter so i must give you that as well

     https://forge.puppet.com/leonardothibes/wget

    As also required is the file to configure the jmx exporter configuration file in order to translate the JMX data provided by Kafka to fields to be imported in Prometheus
    prometheus_config:

    lowercaseOutputName: true
    rules:
    - pattern : kafka.cluster<type=(.+), name=(.+), topic=(.+), partition=(.+)><>Value
      name: kafka_cluster_$1_$2
      labels:
        topic: "$3"
        partition: "$4"
    - pattern : kafka.log<type=Log, name=(.+), topic=(.+), partition=(.+)><>Value
      name: kafka_log_$1
      labels:
        topic: "$2"
        partition: "$3"
    - pattern : kafka.controller<type=(.+), name=(.+)><>(Count|Value)
      name: kafka_controller_$1_$2
    - pattern : kafka.network<type=(.+), name=(.+)><>Value
      name: kafka_network_$1_$2
    - pattern : kafka.network<type=(.+), name=(.+)PerSec, request=(.+)><>Count
      name: kafka_network_$1_$2_total
      labels:
        request: "$3"
    - pattern : kafka.network<type=(.+), name=(\w+), networkProcessor=(.+)><>Count
      name: kafka_network_$1_$2
      labels:
        request: "$3"
      type: COUNTER
    - pattern : kafka.network<type=(.+), name=(\w+), request=(\w+)><>Count
      name: kafka_network_$1_$2
      labels:
        request: "$3"
    - pattern : kafka.network<type=(.+), name=(\w+)><>Count
      name: kafka_network_$1_$2
    - pattern : kafka.server<type=(.+), name=(.+)PerSec\w*, topic=(.+)><>Count
      name: kafka_server_$1_$2_total
      labels:
        topic: "$3"
    - pattern : kafka.server<type=(.+), name=(.+)PerSec\w*><>Count
      name: kafka_server_$1_$2_total
      type: COUNTER
    
    - pattern : kafka.server<type=(.+), name=(.+), clientId=(.+), topic=(.+), partition=(.*)><>(Count|Value)
      name: kafka_server_$1_$2
      labels:
        clientId: "$3"
        topic: "$4"
        partition: "$5"
    - pattern : kafka.server<type=(.+), name=(.+), topic=(.+), partition=(.*)><>(Count|Value)
      name: kafka_server_$1_$2
      labels:
        topic: "$3"
        partition: "$4"
    - pattern : kafka.server<type=(.+), name=(.+), topic=(.+)><>(Count|Value)
      name: kafka_server_$1_$2
      labels:
        topic: "$3"
      type: COUNTER
    
    - pattern : kafka.server<type=(.+), name=(.+), clientId=(.+), brokerHost=(.+), brokerPort=(.+)><>(Count|Value)
      name: kafka_server_$1_$2
      labels:
        clientId: "$3"
        broker: "$4:$5"
    - pattern : kafka.server<type=(.+), name=(.+), clientId=(.+)><>(Count|Value)
      name: kafka_server_$1_$2
      labels:
        clientId: "$3"
    - pattern : kafka.server<type=(.+), name=(.+)><>(Count|Value)
      name: kafka_server_$1_$2
    
    - pattern : kafka.(\w+)<type=(.+), name=(.+)PerSec\w*><>Count
      name: kafka_$1_$2_$3_total
    - pattern : kafka.(\w+)<type=(.+), name=(.+)PerSec\w*, topic=(.+)><>Count
      name: kafka_$1_$2_$3_total
      labels:
        topic: "$4"
      type: COUNTER
    - pattern : kafka.(\w+)<type=(.+), name=(.+)PerSec\w*, topic=(.+), partition=(.+)><>Count
      name: kafka_$1_$2_$3_total
      labels:
        topic: "$4"
        partition: "$5"
      type: COUNTER
    - pattern : kafka.(\w+)<type=(.+), name=(.+)><>(Count|Value)
      name: kafka_$1_$2_$3_$4
      type: COUNTER
    - pattern : kafka.(\w+)<type=(.+), name=(.+), (\w+)=(.+)><>(Count|Value)
      name: kafka_$1_$2_$3_$6
      labels:
        "$4": "$5"

    Ok, so in order to put this together, we will use plain old hiera :). For the server on which you want to configure prometheus server you will need to create a role or just put it in the fqdn.yaml that looks like this:

    prometheus.yaml

    ---
    classes:
      - 'profiles::prometheusserver'
      - 'profiles::grafana'
    
    alertrules:
        -
            name: 'InstanceDown'
            condition:  'up == 0'
            timeduration: '5m'
            labels:
                -
                    name: 'severity'
                    content: 'critical'
            annotations:
                -
                    name: 'summary'
                    content: 'Instance {{ $labels.instance }} down'
                -
                    name: 'description'
                    content: '{{ $labels.instance }} of job {{ $labels.job }} has been down for more than 5 minutes.'
    

    This is as default installation, because it’s a “role”, on each prometheus host i also created a specific fqdn.yaml file to specify in order to tell what nodes should be checked for exposed metrics. Here is an example:

    ---
    profiles::prometheusserver::nodes:
        - 'kafka0:7071'
        - 'kafka1:7071'
        - 'kafka2:7071'
    

    The three nodes are as an example, you can put all the nodes on which you include the prometheus node class.
    Let me show you how this should also look:

    ---
    classes:
     - 'profiles::prometheusnode'
     
    profiles::kafka::jolokia: '-javaagent:/usr/share/java/jolokia-jvm-agent.jar -javaagent:/opt/jmxexporter/jmx_prometheus_javaagent-0.9.jar=7071:/opt/jmxexporter/prometheus_config.yaml

    Now i need to explain that jolokia variable, right? Yeah, it’s pretty straight forward. The kafka installation was already wrote, and it included the jolokia agent and our broker definition block looks like this:

    
     class { '::kafka::broker':
        config    => $broker_config,
        opts      => hiera('profiles::kafka::jolokia', '-javaagent:/usr/share/java/jolokia-jvm-agent.jar'),
        heap_opts => "-Xmx${jvm_heap_size}M -Xms${jvm_heap_size}M",
      }
    }

    So i needed to puth the jmx exporter agent beside jolokia on kafka startup, and when this will be deployed you will see the jmxexporter started as agent. Anyhow, when all is deployed you will have a prometheus config that should look like:

    ---
    global:
      scrape_interval: 15s
      evaluation_interval: 15s
      external_labels:
        monitor: master
    rule_files:
    - /etc/prometheus/alert.rules
    scrape_configs:
    - job_name: prometheus
      scrape_interval: 30s
      scrape_timeout: 30s
      static_configs:
      - targets:
        - localhost:9090
        labels:
          alias: Prometheus
    - job_name: kafka
      scrape_interval: 10s
      scrape_timeout: 10s
      static_configs:
      - targets:
        - kafka0:7071
        - kafka1:7071
        - kafka2:7071

    You can also see the nodes at Status -> Targets from the menu, and yeah, all the metrics are available by node at http://[kafka-node]:7071/metrics.

    I think this should be it, i don’t know i covered everything and there are a lot of details related to our custom installation but at least i managed to provide so details related to it. The article that helped me very much to do is can be visited here

    https://www.robustperception.io/monitoring-kafka-with-prometheus/

    Cheers!
  • List paths created by package install on Ubuntu

    Hi,

    I was searching this morning to see what paths and files were created using package install with puppet and i found this:

    root@test:~# apt list --installed | grep goss
    
    WARNING: apt does not have a stable CLI interface yet. Use with caution in scripts.
    
    goss/trusty,now 0.3.0-3 amd64 [installed]
    root@test:~# dpkg-query -L goss
    /.
    /usr
    /usr/bin
    /usr/bin/goss
    /usr/share
    /usr/share/doc
    /usr/share/doc/goss
    /usr/share/doc/goss/changelog.gz
    

    No other things to add.
    Cheers!

  • Wrong Kafka configuration and deployment using puppet

    Hi,

    I just want to share with you one case that we have last week and that involved some wrong kafka deplyment from puppet that actually filled the filesystems and got our colleagues that were using it for a transport layer on ELK.

    Lets start with the begining, we have some puppet code to deploy and configure kafka machines. To keep it simple the broker config block from puppet looks like this:

    $broker_config = {
        'broker.id'                     => '-1', # always set broker.id to -1.
        # broker specific config
        'zookeeper.connect'             => hiera('::kafka::zookeeper_connect', $zookeeper_connect),
        'inter.broker.protocol.version' => hiera('::kafka::inter_broker_protocol_version', $kafka_version),
        'log.dir'                       => hiera('::kafka::log_dir', '/srv/kafka-logs'),
        'log.dirs'                      => hiera('::kafka::log_dirs', '/srv/kafka-logs'),
        'log.retention.hours'           => hiera('::kafka::log_retention_hours', $days7),
        'log.retention.bytes'           => hiera('::kafka::log_retention_bytes', '-1'),
        # confiure availability
        'num.partitions'                => hiera('::kafka::num_partitions', 256),
        'default.replication.factor'    => hiera('::kafka::default_replication_factor', $default_replication_factor),
        # configurre administratability (this is a word now)
        'delete.topic.enable'           => hiera('::kafka::delete_topic_enable', 'true'),
      }
    

    As you can see, there are two fields that need to be carefully configured, one is the log_retention_bytes and the other is the num_partitions. I am underlying this for a very simple reason, if we will take a look in the kafka server.properies file which the engine use to start the broker, we will see

    log.retention.bytes=107374182400
    num.partitions=256

     Now, the first one is the default value (and it means the maximum size per partition), and if you go to an online converter you will see that it means 100GB. This shouldn’t be a problem if you override it topic based, and even more if you manually create a topic with one or two partitions and you have the required space. But our case was different, they were using for logstash which created a default topic configuration with 256 partitions and if the maximum size was 100GB then it though it had 25600GB which i am not mistaken should also translate in 25TB (yeah, that it’s usually more than enough for a ELK instance).

    Since we were running only three nodes with 100GB filesystem each, you can imagine that it filled up and the servers crashed.

    Now there are two ways to avoid this, depending the number of consumers in the consumer group, and also the retention period. If you have only one consumer and you want to have data for a larger period of time, you can leave it at 100GB (if you have that much storage available) and manually create a topic with 1 partition and a replication factor equal to the number of nodes that you want to use for high availability, or you can leave the partition number to 256, and you highly decrease the retention bytes value. This translates in an equal distribution of data on multiple consumers, but it comes with a lesser storage period of time (now it is also true that it depends on the amount and type of data that you are transferring).

    The solution that we adopted is to leave the partition number unchanged and decrease the partition size to 200MB. Keep you informed how it works. 🙂

    Cheers!

  • Sysdig container isolation case debugged on kubernetes

    Hi,

    I didn’t get to actual test anything related to this but i managed to find a very interesting article that might be lost if you are not a sysdig fan. You can find it at following link https://sysdig.com/blog/container-isolation-gone-wrong/

    To put into perspective, this tool is used for some very interesting debugging situation, i have played with it some a short period of time and i think i will put in on my list so that i can show you what it can do.

    Cheers

  • Install eyaml module on puppet master

    Hi,

    Today i will show how i installed module used for data encrypt in order to safely include it in hiera yaml files)
    It really simple as described on https://github.com/voxpupuli/hiera-eyaml. The actual step that i couldn’t find explicitly written in the doku and i had to figure it out myself is that you need to modify the config.yaml needed by the module.

    1. gem install hiera-eyaml
    2. puppetserver gem install hiera-eyaml
    3. eyaml createkeys
    4. mv ./keys /etc/puppetlabs/puppet/eyaml
    5. $ chown -R puppet:puppet /etc/puppetlabs/puppet/eyaml
      $ chmod -R 0500 /etc/puppetlabs/puppet/eyaml
      $ chmod 0400 /etc/puppetlabs/puppet/eyaml/*.pem
      $ ls -lha /etc/puppetlabs/puppet/eyaml
      -r——– 1 puppet puppet 1.7K Sep 24 16:24 private_key.pkcs7.pem
      -r——– 1 puppet puppet 1.1K Sep 24 16:24 public_key.pkcs7.pem
    6.  vim /etc/eyaml/config.yaml and add following content:
      ---
      pkcs7_private_key: '/etc/puppetlabs/puppet/eyaml/private_key.pkcs7.pem'
      pkcs7_public_key: '/etc/puppetlabs/puppet/eyaml/public_key.pkcs7.pem'

    If the last step is not executed, you will get the error: [hiera-eyaml-core] No such file or directory – ./keys/public_key.pkcs7.pem

    After these configurations you should be able to encrypt files or strings. Short example:

    eyaml encrypt -s 'test'
    [hiera-eyaml-core] Loaded config from /etc/eyaml/config.yaml
    string: ENC[PKCS7,MIIBeQYJKoZIhvcNAQcDoIIBajCCAWYCAQAxggEhMIIBHQIBADAFMAACAQEwDQYJKoZIhvcNAQEBBQAEggEAvWHMltzNiYnp0iG6vl6tsgayYimoFQpCFeA8wdE3k6h2OGZAXHLOI+ueEcv+SXVtOsqbP2LxPHe19zJS9cLV4tHu1rUEAW2gstkImI4FoV1/SoPrXNsBBXuoG3j7R4NGPpkhvOQEYIRTT9ssh9hCrzkEMrZ5pZDhS4lNn01Ax1tX99NdmtXaGvTTML/kV061YyN3FaeztSUc01WwpeuHQ+nLouuoVxUUOy/d/5lD5wLKq9t8BYeFG6ekq/D9iGO6D/SNPB0UpVqdCFraAN7rIRNfVDaRbffCSdE59AZr/+atSdUk9cI0oYpG25tHT9x3eWYNNeCLrVAoVMiZ01uR7zA8BgkqhkiG9w0BBwEwHQYJYIZIAWUDBAEqBBBHO9P8JfkovKLMdtvaIxAzgBAjiu0/l+Hm+Xaezhp2AWjj]
    
    OR
    
    block: >
        ENC[PKCS7,MIIBeQYJKoZIhvcNAQcDoIIBajCCAWYCAQAxggEhMIIBHQIBADAFMAACAQEw
        DQYJKoZIhvcNAQEBBQAEggEAvWHMltzNiYnp0iG6vl6tsgayYimoFQpCFeA8
        wdE3k6h2OGZAXHLOI+ueEcv+SXVtOsqbP2LxPHe19zJS9cLV4tHu1rUEAW2g
        stkImI4FoV1/SoPrXNsBBXuoG3j7R4NGPpkhvOQEYIRTT9ssh9hCrzkEMrZ5
        pZDhS4lNn01Ax1tX99NdmtXaGvTTML/kV061YyN3FaeztSUc01WwpeuHQ+nL
        ouuoVxUUOy/d/5lD5wLKq9t8BYeFG6ekq/D9iGO6D/SNPB0UpVqdCFraAN7r
        IRNfVDaRbffCSdE59AZr/+atSdUk9cI0oYpG25tHT9x3eWYNNeCLrVAoVMiZ
        01uR7zA8BgkqhkiG9w0BBwEwHQYJYIZIAWUDBAEqBBBHO9P8JfkovKLMdtva
        IxAzgBAjiu0/l+Hm+Xaezhp2AWjj]
    

    Will write something similar for Hiera configuration to use the desired backend.

    Cheers!

  • Small Mirror Maker test between different Kafka clusters

    Hi,

    Today i am trying to show you what i have been playing with for the last day. There was a business case in which some colleagues from Analytics wanted to replicate all the data from other systems in their cluster.

    We will start with this, two independent configured clusters with 3 servers each (on each server we have one zookeeper and one kafka node). On both the source and target i created a topic replicated three times with five partitions. You can find the description

    /opt/kafka/bin/kafka-topics.sh --zookeeper localhost:2181 --describe --topic test-topic
    Topic:test-topic	PartitionCount:5	ReplicationFactor:3	Configs:
    	Topic: test-topic	Partition: 0	Leader: 1002	Replicas: 1002,1003,1001	Isr: 1002,1003,1001
    	Topic: test-topic	Partition: 1	Leader: 1003	Replicas: 1003,1001,1002	Isr: 1003,1001,1002
    	Topic: test-topic	Partition: 2	Leader: 1001	Replicas: 1001,1002,1003	Isr: 1001,1002,1003
    	Topic: test-topic	Partition: 3	Leader: 1002	Replicas: 1002,1001,1003	Isr: 1002,1001,1003
    	Topic: test-topic	Partition: 4	Leader: 1003	Replicas: 1003,1002,1001	Isr: 1003,1002,1001
    

    The command for creating this is actually pretty simple and it goes like this /opt/kafka/bin/kafka-topics.sh –zookeeper localhost:2181 –create –replication-factor 3 –partition 5 –topic test-topic

    Once the topic are created on both kafka instances we will need to start Mirror Maker (HortonWorks recommends that the process should be created on the destination cluster). In order to do that, we will need to create two config files on the destination. You can call them producer.config and consumer.config.

    For the consumer.config we have the following structure:

    bootstrap.servers=source_node0:9092,source_node1:9092,source_node2:9092
    exclude.internal.topics=true
    group.id=test-consumer-group
    client.id=mirror_maker_consumer
    

    For the producer.config we have the following structure:

    bootstrap.servers=destination_node0:9092,destination_node1:9092,destination_node2:9092
    acks=1
    batch.size=100
    client.id=mirror_maker_producer
    

    These are the principal requirements and also you will need to be sure that you have in you consumer.properties the following line group.id=test-consumer-group.

    Ok, so far so good, now lets start Mirror Maker with and once started you can see it beside kafka and zookeeper using ps -ef | grep java

    /opt/kafka/bin/kafka-run-class.sh kafka.tools.MirrorMaker --consumer.config ../config/consumer.config --producer.config ../config/producer.config --whitelist test-topic &

    To check the offset, at new versions of kafka you can always use

    /opt/kafka/bin# ./kafka-run-class.sh kafka.admin.ConsumerGroupCommand --group test-consumer-group --bootstrap-server localhost:9092 --describe
    GROUP                          TOPIC                          PARTITION  CURRENT-OFFSET  LOG-END-OFFSET  LAG             OWNER
    test-consumer-group            test-topic                     0          2003            2003            0               test-consumer-group-0_/[dest_ip]
    test-consumer-group            test-topic                     1          2002            2002            0               test-consumer-group-0_/[dest_ip]
    test-consumer-group            test-topic                     2          2003            2003            0               test-consumer-group-0_/[dest_ip]
    test-consumer-group            test-topic                     3          2004            2004            0               test-consumer-group-0_/[dest_ip]
    test-consumer-group            test-topic                     4          2002            2002            0               test-consumer-group-0_/[dest_ip]
    

    I tested the concept by running a short loop in bash to create 10000 records and put them to a file for i in $( seq 1 10000); do echo $i; done >> test.txt  and this can be very easily imported on our producer by running the command /opt/kafka/bin/kafka-console-producer.sh –broker-list localhost:9092 –topic test-topic < test.txt

    After this is finished, please feel free to take a look in the topic using /opt/kafka/bin/kafka-console-consumer.sh –bootstrap-server localhost:9092 –topic test-topic –from-beginning and you should see a lot of lines 🙂

    Thank you for your time and if there are any parts that i missed, please reply.

    Cheers!

  • Check Kafka JMX node stats using JConsole

    Hi,

    As you probably know, Kafka is already publishing a lot of performance data on JMX to be collected.
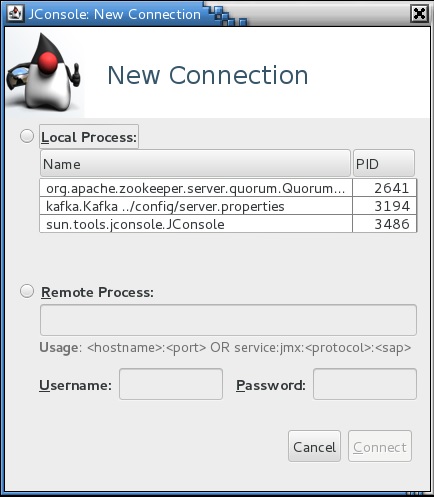
    In order to do this, you will need to install jconsole (for Windows it’s already embedded in the jdk installation, for Linux you can use this article to check it out https://www.garron.me/en/linux/find-which-package-library-belongs.html. After you have done that, you will have just to export the JMX_PORT variable to you env (for example export JMX_PORT=9999) before you start the Kafka node. When you will open JConsole you will probably see something like

    After you select the Kafka node, it will tell you that the connection is not secure, but it doesn’t matter for my point of view and after that you can have a overview of the process. The statistics are available MBens tab and extra info regarding the meaning you can find in the official doku and also in the DataDog article.

    This is a single simple node configuration, if it is required i will post some complex configurations, but this is required in special cases, standard monitoring using DataDog/Prometheus or other solution needs to be implemented in case of a bigger infrastructure.

    Cheers

  • Small Vagrant config file for Rancher deploy

    Hi,

    Just wanted to post this also, if it’s not that nice the config using a jumpserver, surely we can convert that to code (Puppet/Ansible), you can also use Vagrant. The main issue that i faced when i tried to create my setup is that for a reason (not really sure why, Vagrant on Windows runs very slow). However, i chose to give you one piece of Vagrantfile for a minimal setup on which you can grab the Rancher server framework and also the client containers.

    Here is it:

    # -*- mode: ruby -*-
    # vi: set ft=ruby :
    Vagrant.configure("2") do |config|
    config.vm.define "master" do |master|
    master.vm.box = "centos/7"
    master.vm.hostname = 'master'
    master.vm.network "public_network", bridge: "enp0s25"
    end
    config.vm.define "slave" do |slave|
    slave.vm.box = "centos/7"
    slave.vm.hostname = 'slave'
    slave.vm.network "public_network", bridge: "enp0s25"
    end
    config.vm.define "swarmmaster" do |swarmmaster|
    swarmmaster.vm.box = "centos/7"
    swarmmaster.vm.hostname = 'swarmmaster'
    swarmmaster.vm.network "public_network", bridge: "enp0s25"
    end
    config.vm.define "swarmslave" do |swarmclient|
    swarmclient.vm.box = "centos/7"
    swarmclient.vm.hostname = 'swarmclient'
    swarmclient.vm.network "public_network", bridge: "enp0s25"
    end
    end


    Do not worry about the naming of the machines, you can change them to whatever you like, the main catch is to bridge the public network in all of them in order to be able to communicate with each other and also have access to the docker hub. Beside that everything else that i posted regarding the registry to the Rancher framework is still valid.

    Thank you for your time,

    Cheers!

  • Monitoring Kafka with DataDog

    Hi,

    A very interesting series of articles that should be checked regarding one option of Kafka monitoring with Datadog :

     https://www.datadoghq.com/blog/monitoring-kafka-performance-metrics/.

    I will have in the near future a task regarding this, will post the outcome when it’s done.

    P.S: It was done and you can find the implementation here :

    Integrate Kafka with Datadog monitoring using puppet

    As for the metrics point of view we will see if this is really an option, i have tried the same with Prometheus and Grafana and it seems to wok better. Keep you posted

    Cheers

  • Monitoring Kafka node using Docker

    Hi,

    Today i am just going to point you to a very interesting article related to monitoring of Kafka node/nodes using InfluxDB, Grafana and Docker. Hope it is useful, i will surely try it in one of the days.

    https://softwaremill.com/monitoring-apache-kafka-with-influxdb-grafana/

    Now this is not quite standard but nevertheless it is an option.

    Cheers!